WCPSS May Not Meet NC's Outdated Minimum Ventilation Standards
Guest Post by Edderic Ugaddan, Senior Data Scientist, Quant at People's CDC
.png)
.png)


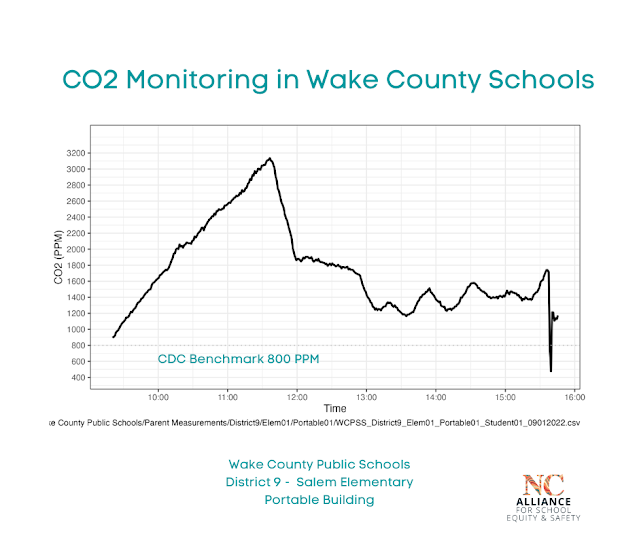
For this classroom which had 17 3rd graders and 1 teacher, to meet code of 7.5 CFM/person, we expect the steady-state CO2 concentration (i.e. horizontally flat section) to be just below 1500ppm (see red line)
The blue line is the CO2 curve associated with the more modern ASHRAE 62.1-2022 ventilation standard for classrooms of ~13-15 CFM/person, which is code in most places.
However, in the first few hours in this graph, the recorded CO2 concentration was above the 1500 ppm limit line, even reaching more than 2x the limit!

Occupancy stayed the same (16 3rd graders, 1 teacher), along with activity levels throughout that time. Therefore, for that block of time, it follows that the outdoor ventilation rate supplied to the occupants in this room is less than 7.5 CFM / person.
Here's the code which says 7.5 CFM / person for classrooms: https://codes.iccsafe.org/content/NCMC2018/chapter-4-ventilation#NCMC2018_Ch04_Sec403.2

Note that the code says that the 7.5 CFM/person is delivered “continuously” when the building is occupied, not “sometimes.”

We use the mass balance equation in it, which basically tells us how CO2 concentrations would change over time. It depends on the CO2 generation rate by people, along with the clean air delivery rate, along with the outdoor ambient CO2 concentration.

We use the first few points of the CO2 readings, feed that into the mass balance equation, and create this model, which can predict the data it was trained on (in-sample), and fit the existing data it hasn’t seen (out-of-sample).

It essentially says that, had this ventilation rate in the beginning of the day continued over time, and that everything else stayed constant (i.e. number of 3rd graders and teacher stayed there, doing the same thing they were doing earlier in the day), then CO2 readings could have reached somewhere between 5,000 ppm and ~10,000 ppm. Note that 5,000 ppm for a long period of time would have been an OSHA violation. https://www.osha.gov/publications/hib19960605#:~:text=The%20current%20OSHA%20standard%20is,can%20produce%20unconsciousness%20or%20death

How much outdoor air were the students getting? The model puts all probability under 2 CFM/person. Kids and teacher were getting way less than the 7.5 CFM/person for a little more than 2 hours. See third row below:

Addressing threats to validity: We want to know if we can trust the data used in this analysis to trust the results. There’s a term in data analysis: GIGO, which stands for “Garbage in, Garbage Out.”
How do we know that the results are not garbage? Let’s think about the inputs and ask, what makes a bad CO2 reading?
- Reading is too close to the someone’s mouth, so the monitor is picking up more of the person’s breath, which has high concentration of CO2 relative to the environment.
- Reading is taken when CO2 is not well-mixed.
I was told that the reading was taken on the floor in a backpack, not in what’s considered the breathing area. This implies two things: that the CO2 monitor is at least 3 feet away (~2m) from a 3rd grader’s direct line of breath, so the first concern of the reading being too close to someone’s mouth is no longer a concern. Aranet, the manufacturer of the CO2 monitoring device used, said that 1.5m-2m away from the breathing zone is enough: https://forum.aranet.com/all-about-aranet4/distance-to-put-sensor-from-a-person-in-classroom/

However, in that thread, they also mention that CO2 is heavier than nitrogen and oxygen, so it’s possible to get higher readings on the floor than in the breathing area.
There is evidence to support that height does give statistically significant readings. In this paper, researchers place CO2 monitors 1.1m and 1.6m from the floor, horizontally spread out. https://journals.sagepub.com/doi/pdf/10.1177/1420326X211058743
However, a difference can be statistically significant, but it doesn’t mean it’s a large difference. Graph below shows averaged readings of different locations across classrooms, done with different ventilation scenarios (e.g. 600m3/h mixing, no ventilation, open windows, open windows and door). Let’s focus on graph (a), which has readings at 1.1m from the floor, vs graph (b), which has readings at 1.6m.

If we linearly extrapolate to the floor, that would mean the readings done at 1.6m vs. readings done on the floor would be a difference of about 3 * 50ppm, which is 150ppm.
- One evidence is that CO2 readings were climbing way over the 1500 ppm limit associated with 7.5 CFM/person for this classroom.
- Second, model fitting using the first 10 minutes of readings and the mass balance equation, which relates CO2 readings with ventilation, not necessarily during steady-state, shows that kids and teacher were getting less than 2 CFM/person for a little over two hours.
- NCASES is monitoring CO2 and advocating for ventilation and air quality in schools upon learning there is no systemic data in many school districts, including schools across Wake County.
- NCASES does not claim to be nor are we IAQ experts. Our data and analysis is not claiming to be a professional air quality assessment.
- School/district should verify on their own through qualified, independent analysis.
.png)
Comments
Post a Comment